
An Overview of the Recent Years on Business Immigration and Taxation Trends in some Countries of Central and East Europe and Scandinavia
Business Immigration in the Context of General Immigration Process
In this Overview we decided to select several countries from the Central and East Europe (Estonia, Latvia, Poland, Slovak Republic and Czech Republic) as well from Scandinavia (Denmark and Sweden) in order as possible more to perceive business immigration trends of the recent years, get acquainted with the changes that occured, and also to find out with the basic taxes in those countries. All previously mentioned countries belongs to European Union and to its single market. The immigration law requirements that adopting to the citizens from the third countries wishing to get them a residence permit in one of these countries of EU on the basis of lawful activity (i.e., business activity) are not fundamentally different, but exists the difference in accomplishment mechanism of these requirements and measures by which is seeking to mitigate or tighten the settle for living and work purposes in one of these EU countries to citizens of third nationals.
Knowing the general social situation of the recent years in Europe triggered by Refugee crisis when become difficult to adjust and take control over unstoppable refugee flows, incoming from some North African countries, and from the region of the Middle East, European Union in general level responded to restrict existing immigration laws. Germany and Sweden became major targets in the Old Cointnent to the refugees wishing to get a residence permit and settle there.Is important to underline that countries in the region of the Central and East Europe is not a major object of interest to refugees because of less developed economics comparing to western European states ,and existing high homophobic sentiments generally against immigrants. Through the adopted economic developments programs to promote some countries of the Central and East European (Poland, Czech Republic, Slovakia) expressed an open position in government level (with the some clauses) that allowing to attract business immigrants from the third countries for living and business purposes.
According to United Nations published data for the year 2013, the top five countries of the biggest number of migrants leaving their own homes for immigration to much more higher economically developed world states looks following : India (14 million), Mexico (13 million), Russian Federation (11 million), PR China (9 million), and Bangladesh (8 million). Such immigration reasons may be not be only the economical, there are existing a numerous other reasons making people to leave their native homes, like recurring natural disasters, political instability,cultural, social and religious aspects, ecological problems, and other reasons. It is likely that a certain percentage of these immigrants chosed better living conditions having world countries for business development purposes, so that’s why European Union is one of an attractive regions in the world that able to compete with the other high developed states and markets, like USA, Canada, Australia, Japan,and etc.
Below is provided the table showing the figures of external migration changes under existing general immigration index during the period approx. of the last 10 years from 2006 to 2015 (here is included countries, like Latvia, Poland, Sweden, Denmark and Czech Republic) :
| Immigration | ||||||||||
| 2006 | 2007 | 2008 | 2009 | 2010 | 2011 | 2012 | 2013 | 2014 | 2015 | |
| Total | 2 234 | 3 741 | 3 671 | 3 884 | 2 810 | 3 709 | 2 639 | 4 098 | 3 904 | 15 413 |
| Austria | 10 | 14 | 18 | 19 | 17 | 5 | 7 | 15 | 12 | 11 |
| Belgium | 21 | 37 | 33 | 32 | 13 | 14 | 13 | 26 | 19 | 39 |
| Spain | 23 | 51 | 60 | 74 | 33 | 29 | 37 | 44 | 25 | 35 |
| Netherlands | 16 | 29 | 21 | 32 | 19 | 7 | 23 | 21 | 17 | 23 |
| Ireland | 12 | 42 | 47 | 52 | 54 | 79 | 64 | 109 | 80 | 109 |
| Italy | 58 | 52 | 60 | 75 | 51 | 20 | 29 | 25 | 28 | 32 |
| Lithuania | 47 | 54 | 76 | 54 | 21 | 7 | 5 | 14 | 22 | 47 |
| Luxembourg | 4 | 9 | 2 | 10 | 7 | 3 | 6 | 11 | 5 | 13 |
| Latvia | 84 | 120 | 92 | 130 | 82 | 42 | 25 | 61 | 82 | 77 |
| Norway | 22 | 15 | 33 | 37 | 28 | 26 | 43 | 81 | 91 | 82 |
| Poland | 22 | 73 | 36 | 47 | 13 | 6 | 2 | 8 | 8 | 5 |
| France | 38 | 41 | 63 | 74 | 70 | 29 | 18 | 33 | 36 | 46 |
| Sweden | 96 | 99 | 112 | 114 | 74 | 55 | 54 | 59 | 64 | 138 |
| Germany | 129 | 179 | 184 | 161 | 70 | 58 | 49 | 83 | 68 | 108 |
| Finland | 665 | 1 468 | 1 151 | 1 214 | 1 020 | 1 149 | 509 | 1 067 | 1 290 | 2 673 |
| Great Britain | 102 | 127 | 128 | 133 | 108 | 118 | 165 | 294 | 288 | 345 |
| Switzerland | 10 | 8 | 4 | 6 | 9 | 8 | 7 | 15 | 8 | 8 |
| Denmark | 15 | 28 | 16 | 21 | 16 | 9 | 15 | 9 | 10 | 16 |
| Czech Republic | 10 | 24 | 23 | 23 | 13 | 17 | 4 | 17 | 4 | 6 |
| Ukraine | 91 | 184 | 192 | 237 | 112 | 272 | 206 | 340 | 428 | 697 |
| Belarus | 26 | 49 | 40 | 41 | 22 | 58 | 43 | 55 | 53 | 34 |
| Russia | 498 | 651 | 798 | 757 | 622 | 1 200 | 852 | 955 | 747 | 656 |
| Africa | 7 | 11 | 25 | 13 | 27 | 25 | 23 | 47 | 19 | 88 |
| Asia | 96 | 154 | 163 | 225 | 125 | 221 | 190 | 322 | 146 | 244 |
| America | 95 | 117 | 163 | 168 | 83 | 159 | 155 | 206 | 182 | 129 |
| USA | 69 | 79 | 128 | 126 | 54 | 101 | 119 | 150 | 132 | 98 |
Source : www.iom.int, World Migration Organization data for 2015
The Law Order that regulating an acceptance procedure of the foreign citizens from the third countries, aiming to invest in the territory of EU as well in this territory to set up an own business or expand it in a selected country, is not generally harmonized at EU level. Therefore, EU member states has determinated basic migration priorities and principles in the national laws that regulate the rules of legal status of the foreign citizens in their countries. Hence, may differ (and they are vary) acceptance programs and order of issuance necessary permits for the third nationals in their right to obtain a residency on the grounds of lawful activity, requirements for accepting documents, document examination term by responsible state institutions, and the grounds on which such residence permits are granted, or not. During the recent years the requirements to third nationals in order to get them such permits became much more stringent. For instance, in Sweden in a whole period of 2013 were issued approx. 300 residence permits on the basis of business for the first time applying foreign citizens, other sources shows that were issued over 115 thousand of residency permit to aliens on the basis of business. The majority of such permits was issued to foreigners able to start an own business or to the foreign persons just purchased registered small sized companies in this country.
Statistics provided by Swedish Migration offices on applying number of foreign citizens to issue them a residence permit on the basis of business and a number of issued visas of separate category C and D :
| 2009 | 2010 | 2011 | 2012 | 2013 | |
| No. of applications for residence permit | 301 | 382 | 470 | 630 | 647 |
| Issued residence permits | 129 | 88 | 106 | 332 | 277 |
| Refused to issue residence permits | 91 | 128 | 139 | 278 | 188 |
| 2009 | 2010 | 2011 | 2012 | 2013 | |
| No.of D visa issued on the basis of business | 48 | 43 | 157 | 234 | 194 |
| No.of C visa (Schengen) issued on the basis of business | 40 356 | 53 060 | 57 836 | 56 196 | 51 524 |
As we may see from provided both tables, despite existing vague formulations in Swedish laws that regulates the legal status of citizens from the third countries in Sweden, number of applying persons for residence permit issuance on the basis of business during the provided in the table years has increased gradually.
Sweden, Denmark, Poland, Czech Republic and Estonia has well developed net of running representative offices of trade in the third countries.One of the basic aims of their activity – to promote business subjects from the third countries by investing in EU single market, or by establishing company representative offices there and thus be generally involved in doing business being in the EU single market .
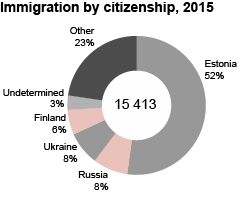
According to the Department of Statistics of Estonia, last year (2015), immigration rates first time of the country’s history has exceeded emigration volumes.Number of arrived people to Estonia that year compensated (recovered) a decline of country’s population. 21 % immigrants chosed Estonia as a target country were citizens from the other EU countries, 27 % arrived from the third countries. As shows the statistics, even 52% persons having an Estonian citizenship has returned back into country. Citizens from non-EU countries visited Estonia mainly due to following purposes : business registration and development, family reunification, job in Estonia, studies in Estonia, and etc. Below is provided graphics on immigration by citizenship to Estonia in 2015 :
Data of Population Register Office of Latvia during the period 2010-2013 on the foerign persons intending to invest in the Republic of Latvia, or starting run an own business (Number of application forms in order to get residence permit, number of issued permits and number of refused to issue permits) :
| 2010 | 2011 | 2012 | 2013 | |
| No.of applications to issue residence permits | 40 | 112 | 86 | 94 |
| Issued residence permits | 39 | 112 | 86 | 94 |
| Refused to issue residence permit | 1 | 0 | 0 | 0 |
Foreign direct investments may be also one of the major factors that forming causality to business immigration generally, and has an impact to flows’ increasement of such immigration depending on existing economic situation terms in a country and its ability to attract investments from the third countries to EU single market. .Number of attracted foreign direct investments also shows how one or another EU country is open for it,what is an ability to attract,what kind of resources this country is able to manage and use for coming of the foreign capital into its market. Despite the competition of developing markets among major Third World countries European Union still remains one of the major receivers of foreign direct nvestments in a general world market.For instance, in the year of 2013, incomes coming from the foreign direct investments in a whole market of EU has increased in 14 % and consisted the amount of approx. 246 mlrd. US dollars (cpmparing to the amount of 216,5 mlrd. US dollars in 2012) . In Hungary foreign direct investments during the year 2013 has increased up to 15 mlrd. EUR ( 10,48 mlrd.EUR in 2012), Estonia got incomes from such direct investments in amount of 15,7 mlrd.EUR, in Poland at the end of 2013 the amount has reached 160,5 mlrd.EUR. According to the number of created jobs from such investments Poland in 2013 was at the 3rd position.Slovakia expects in 2016 attract direct investments in approx.amount of 5,5 mlrd. EUR (from both EU and non-EU countries) and thus to create about 35,0 thousand new jobs.
Through the programms on promoting investments designed to foreign business subjects Estonia and Poland aare leading by having trade representative office outside the EU territory (trade representative offices of these EUstates are established in Russia, Ukraine, Japan, USA, India and PR China. Poland through the pecialized governmental institution Information Agency of Foreign Investments is providing professional assistance to the foreign companies that wishing to invest in Poland.
Restrictered requirements that occured in the laws in a biggest part of the states in the Central and East Europe in 2014 designed to the citizens from the third countries wishing them to obtain a residence permit on the grounds of lawful activity (business, investments, creation of new jobs) became a big challenge to them. Such countries, like Lithuania and other from East Europe region expected by adopting these changes put more stricter control against non-honest foreign citizens for which issued residence permit means a possibility freely travel through the Schengen Zone only ,and do not fullfill taken liabilities regarding running business as it they planned to realize and stated in application forms previously. But there were also several countries, like Czech Republic, Slovakia that does not take adopting such restrictions,and now foreign citizens prefer better to choose such friendly states for business immigration in order to start or develop activity.
As provided below tables shows, our selected several EU countries comparatively to others adopts different requirements and specific criteria that should have meet the priorities in economics of each state aiming to assist the third countries businessmens and investors to receive them residence permits to live and work in EU by developing a planned activity. One of these countries from EU provide clear provisions (for instance, Latvia, Poland), other member states like Estonia, Czech Republic or Sweden qat this moment still not clearly formed necessary requirements and provisions of issuance order to the third-country nationals.
Acceptance programs and specific criteria of our selected several EU countries adopting (or non-adopting) to investors from the third-countries aiming to develop activity in a territory of EU
(table)
| The Policy objectives | |||
| EU state | Priority sectors | The main objectives
| Presumable impact on economy |
| CZE | not applicable | not applicable | not applicable |
| EST | not applicable | not applicable | not applicable |
| LAT | – real eatate; – construction; – business | To stop the decline of economy, suffered during the crisis years, to create as possible more jobs, to promote the revival of real estate sector, to establish new companies by purchasing investments for the development of already running ventures | Yes |
| SVK | not applicable | not applicable | not applicable |
| SWE | not applicable | not applicable | not applicable |
| POL | -Automobile industry; -electronics and home appliance production; -aviation;-biotechnologies; -agriculture and food industry;-scientific research; -industry of modern services | To increase the efficiency of national economy and competititviness in economy by attracting investments that should meet national priorities, to promote a highly skilled labor force, increase the number of well-paid jobs. Poland keeps an open policy by aiming to attract investments from the third-countries via realizing special programs | Yes |
| Acceptance requirements | ||||||
| EU member-state | Type of investments | Investment plan | Min.financial requirements | Professional skills | Language knowledge | Census of age |
| CZE | not applicable | not applicable | not applicable | No | No | No |
| EST | not applicable | not applicable | not applicable | No | No | No |
| LAT | -real estate; -business (own capital company) | No | -Investments to own capital company should consist: a) 35’000 EUR, realized through capital company, in which is employed no > than 50 employees and which annual turnover not exceed 10 mln.EUR and during the calendar year is paid no <kaip 40”000 EUR to state budget; b) 150”000 EUR, realized through the capital company,in which is employed no > than 50 employees,and which annual turnover not exceed 10 mln.EUR and during the calendar year is paid no < than 40”000 EUR to state budget. -Real state purchase for no< than 250’000 EUR amount. | No | No | No |
| SVK | not applicable | not applicable | not applicable | not applicable | not applicable | not applicable |
| SWE | not applicable | not applicable | not applicable | not applicable | not applicable | not applicable |
| POL | not applicable | not applicable | not applicable | not applicable | not applicable | not applicable |
Tax Policy Aspects and Prevailing Basic Taxes in several Central and East European countries as well in ScandinaviaSource – European Commision , European Migration Network Edition 2015 (Admitting third-country nationals for business purposes)
For the business migrants from the third countries aiming to set up business and implement a planned activity in the EU territory is important to know an existing basic taxes they should have to pay and tax concessions that adopts our selected EU contries, whether flexibly operating tax base mechanism.Under these factors is making general conclusions, whether in that EU country are existing terms for business development are favorable or not. All the EU countries are obliged to comply set general rules and liabilities on common fiscal policy (tax and taxation issues). At this moment all the state-members agreed in appropriate level to harmonize of a certain tax rules, like VAT or other taxes (excises) designed to gasoline, tobacco, alcohol, and set minimum rates in order to avoid occuring distortions of competition in the whole territory of European Union.
European Union as organization can not dictate to its belonging countries how should they deal with an own tax revenues. For the taxation of individuals and ventures are responsible separate EU member states. Adopting taxes can not be a barrier to a free movement of services and goods in Europe. Most of EU countries are concluded agreements on avoiding double taxation in the territory of EU.
At this moment is intended to transform an existing VAT system that it becomes more simplier in all member-states.
In a table provided below You may get acquainted with he basic taxes from our selected EU countries :
| Country | Corporate Tax | Maximum Income Tax Rate | Standart VAT Rate |
| Czech Republic | 19 % | 22% | 21% (reduced rates up to 15% and 10%) |
| Denmark | 23,5% (since 2016 reduced up to 22%) | 55,56% (including paid social insurance tax) | 25% (reduced rate up to 0% for transportation of passengers for newspapaers published more than 1 time/month. |
| Estonia | 0% on unistibuted profits (20% on distributed profit) | 20% (+2,4% of unemplyment insurance tax, 0,8% paid by employer, 1,6% paid by employee and 33% of social security tax) | 20% (reduced rate up to 9%) |
| Latvia | 15% | 23% | 21% (reduced rates up to 12% and up to 0%) |
| Poland | 19% | 32% | 23% |
| Slovakia | 22% | 19% | 20% (reduced rate up to 10%) |
| Sweden | 22% | 56,6% | 25% (reduced rates up to 12% and up to 6%) |
Note – In Denmark and Sweden (also in Norway) set VAT rate is one of the highest among other European countries.
Main used sources of information :
1. https://emn.lt/- European Migration Net
2. https://ec.europa.eu/immigration/ – Eu immigration portal
3..https://ec.europa.eu/dgs/home-affairs/what-we-do/networks/european_migration_network/reports/studies/results/economic-migration/2014/index_en.htm – European Commission portal
4.https://ec.europa.eu/dgs/home-affairs/what-we-do/networks/european_migration_network/reports/docs/emn-studies/emn_study_admitting_third_country_nationals_for_business_purposes_synthesis_report_04may2015.pdf – European Commission portal / info edition for 2015
5. Website of Estonian Department of Statistics

